Visme presentations infographics are an all-in-one content creation solution that handles slide decks, professional infographic templates, and data visualizations from a single platform. Unlike Canva or PowerPoint, Visme combines export flexibility - including PPTX, video, and SCORM - with built-in brand kit management, making it practical for pitching investors or reporting quarterly results without requiring design skills. Note that the option to Visme Download as PDF free is not available on the Basic plan, so a paid tier is needed to unlock that export format.
Visme fills a gap that most design tools ignore. You get presentation-grade output, infographic templates that actually look professional, and data visualization features that turn spreadsheets into something people want to read. Whether you are pitching investors, reporting quarterly results, or creating social media content, Visme handles the visual heavy lifting without requiring design skills.
This visme presentations infographics guide walks through everything you need to know - from initial setup to advanced features like the AI Designer, brand kit management, and interactive content exports.
Why Visme Presentations Infographics Stand Out
Most design tools force you to choose. Canva excels at quick social media graphics. PowerPoint handles slide decks. Piktochart does infographics. Visme tries to do all three well, and for the most part, it succeeds.
The platform currently holds across major review platforms, reflecting strong performance in design quality and template variety alongside some valid concerns about pricing and performance on complex projects.
What sets Visme apart:
- All-in-one content creation - Presentations, infographics, documents, social media graphics, data visualizations, and interactive content from a single platform
- Data visualization built in - Connect live data sources, create interactive charts, and build dashboards without leaving the editor
- Export flexibility - Output to PPTX, HTML5, video, GIF, PDF, and even SCORM for training materials. No other design tool matches this range
- Brand consistency at scale - Brand kit with custom fonts, colors, and logos applied automatically across every project
Getting Started: Your First Visme Project
Account Setup
Head to visme.co and create an account. The free Basic tier gives you access to the editor with limited templates, 10 AI credits per month, and basic storage. Using the Visme AI presentation maker free of charge is a useful way to explore the platform, but you cannot download finished work on the free plan - so treat it as a preview before committing to a paid tier.
Setup checklist:
- Choose your project type - Presentation, infographic, document, or social graphic. Each opens a category-specific template gallery
- Browse templates - Over 1,000 professionally designed templates across categories. Free tier access is limited, but Starter unlocks the full library
- Set up your brand kit (Pro tier) - Upload your logo, define brand colors, and select brand fonts. The Brand Wizard analyzes your website and auto-generates a complete kit
- Explore AI credits - Basic gets 10, Starter gets 200, Pro gets 500 per month. These power the AI Designer, AI Writer, AI Image Generator, and TouchUp tools
Creating a Presentation
Visme’s presentation builder competes directly with PowerPoint, Google Slides, and tools like Gamma and Beautiful.ai. Compare them all in our best AI presentation tools roundup. Where it differs is in the level of visual control you get without needing design skills.
Presentation workflow:
- Select a presentation template or start from a blank canvas
- Customize slides using the drag-and-drop editor
- Add content blocks - text, images, charts, icons, and video
- Apply animations and transitions between slides
- Use the AI Designer to generate additional slides from text prompts
- Present directly from Visme, or export to PPTX, HTML5, or video
The editor uses a familiar interface if you have used any modern design tool. Objects snap to grids, alignment guides appear automatically, and grouping elements works exactly as you would expect.
The official tutorial above demonstrates Visme’s presentation builder in action. What stands out is how quickly you can build interactive elements - clickable hotspots, hover effects, and embedded media - that static tools like PowerPoint cannot replicate.
Building Infographics That Actually Get Shared
Infographics remain one of the most effective content formats for driving traffic and social shares, but creating them from scratch requires design skills most professionals lack. Visme’s infographic maker bridges that gap.
Infographic Design Process
- Choose an infographic template that matches your data story - statistical, timeline, comparison, process, or informational
- Replace placeholder data with your content. Charts and graphs update automatically when you change values
- Customize colors, fonts, and layout to match your brand
- Add icons from Visme’s built-in library (thousands of options)
- Export as PNG, PDF, or HTML5 for web embedding
What makes Visme infographics better than manual design:
- Data widgets - Progress bars, counters, charts, maps, and comparison meters that you configure with real numbers rather than manually drawing
- Smart resize - Create one infographic, then resize it for different platforms (social media, blog header, print) without rebuilding
- Interactive elements - HTML5 export supports hover tooltips, clickable sections, and animated data reveals that static infographics cannot match
- Live data connections - Link Google Sheets or enter data directly. Charts update when your source data changes
This beginner walkthrough shows the infographic creation process from start to finish. The key takeaway is that you are assembling components rather than designing from scratch, which is why the learning curve is dramatically shorter than tools like Adobe Illustrator or Figma.
Data Visualization: Turning Numbers into Stories
Data visualization is where visme presentations infographics genuinely outshine most competitors in the design space. While Canva offers basic charts and Gamma focuses on AI-generated slides, Visme provides a comprehensive data visualization toolkit that serves everyone from marketing managers to data analysts.
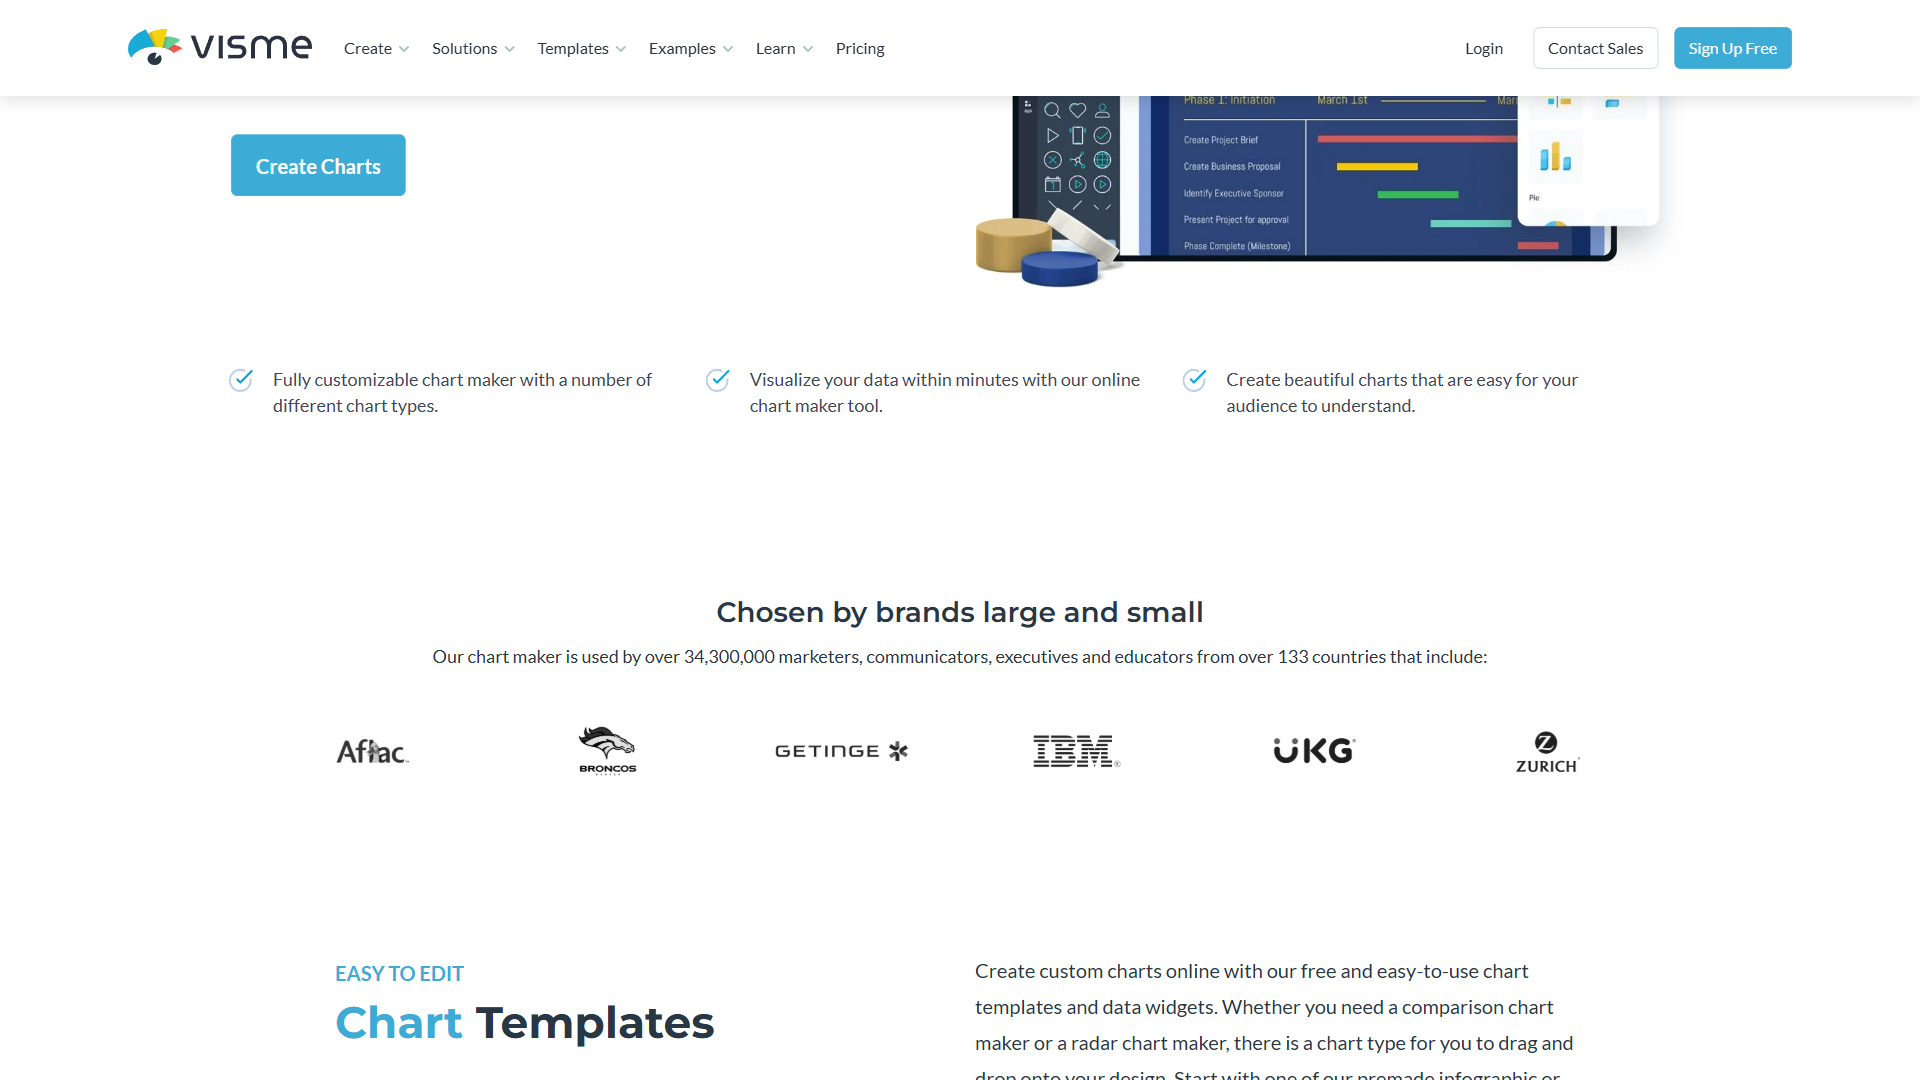
What Chart Types Are Available in Visme?
Visme includes 20+ chart types out of the box:
- Standard charts - Bar, line, pie, donut, area, scatter, and bubble charts
- Comparison charts - Horizontal bar, stacked bar, radar/spider charts
- Progress indicators - Progress bars, radial gauges, counters, and icon arrays
- Geographic - Interactive maps with data overlays
- Specialized - Treemaps, funnels, Mekko charts, and pictographs
How Do You Connect Live Data in Visme?
One of the most underused Visme features is live data integration. Instead of manually updating charts every time your numbers change, you can connect to external data sources.
Data connection options:
- Google Sheets - Link a spreadsheet and charts update automatically when the sheet changes
- Manual data entry - Paste data directly into Visme’s data editor
- CSV import - Upload spreadsheet files for one-time data imports
- Survey data - Integrate survey results from tools like Typeform and SurveyMonkey
This matters for teams creating recurring reports. A monthly performance dashboard connected to Google Sheets updates itself. You open the project, check that the visuals still work with the new data, and publish.
The AI Design Assistant: What It Can (and Cannot) Do
Visme’s AI features use a credit system. The AI Designer, AI Writer, AI Image Generator, and AI TouchUp Tools all draw from the same monthly credit pool. Here is what each does in practice.
AI Designer
Type a prompt describing what you need - “quarterly revenue presentation for SaaS company” or “process infographic showing customer onboarding steps” - and the AI generates a complete design in under 60 seconds. In my testing, about 80% of AI-generated designs need only minor adjustments rather than complete rework.
Where AI Designer excels:
- Generating multiple slide variations quickly
- Creating first drafts that establish layout and visual hierarchy
- Producing designs that respect your brand kit settings
- Handling standard business content types (reports, proposals, pitch decks)
Where it falls short:
- Complex data-heavy layouts sometimes get visual hierarchy wrong
- Creative or artistic designs lack the personality a human designer would add
- Custom illustration requests produce generic results
AI Writer
The AI Writer generates text for your presentations and infographics. Useful for creating slide bullet points, infographic copy, and document content when you know what you want to say but need help with phrasing.
AI Image Tools
The TouchUp suite includes background removal, image upscaler, unblur, and erase/replace. These handle 80% of image editing needs without switching to Photoshop. For dedicated AI image generators, see our best AI image generators roundup. Background removal, in particular, works accurately on product photos and headshots.
Brand Kit: Consistency Without the Hassle
For teams and agencies, the brand kit feature alone justifies the Pro tier. Here is how it works.
Brand Wizard Setup
Enter your website URL and Visme’s Brand Wizard automatically extracts your brand colors, fonts, and logo. In practice, it correctly identifies primary and secondary colors about 90% of the time. You then fine-tune the results and save them as your brand kit.
What the brand kit controls:
- Colors - Primary, secondary, accent, and background colors applied to all new projects
- Fonts - Heading and body fonts, including custom font uploads
- Logo - Your logo auto-placed in designated positions across templates
- Guidelines - Written brand rules visible to all team members
Team Brand Enforcement
On team plans and Enterprise, the brand kit becomes an enforcement mechanism. Team members cannot accidentally use off-brand colors because the brand palette is the default. Templates automatically apply brand fonts. Approval workflows (Enterprise) add a review step before publishing.
Ameritas Insurance’s case study demonstrates this at scale - they reduced design turnaround from weeks to hours by empowering business experts to create brand-compliant content independently.
What Animation and Interactive Content Options Does Visme Offer?
Static presentations lose attention. Visme’s animation and interactivity features keep audiences engaged in ways that PowerPoint transitions cannot match.
Animation Options
- Entrance animations - Objects fly in, fade, zoom, or bounce onto the slide
- Emphasis animations - Pulse, shake, or glow effects to draw attention to key data points
- Exit animations - Objects animate out before the next content appears
- Slide transitions - Smooth transitions between slides, customizable per slide
Interactive Elements (HTML5 Export)
When you export to HTML5, interactive elements become functional:
- Hover effects - Show additional data when viewers hover over chart segments or icons
- Clickable hotspots - Link areas of your infographic to external URLs or other slides
- Pop-up content - Display detailed information in overlay windows
- Embedded video and audio - Play media directly within the presentation
This is particularly valuable for content creators building lead magnets, online courses, or interactive reports that live on a website.
Collaboration Features for Teams
Visme’s collaboration tools work well for distributed teams, though the depth of features depends on your plan tier.
Collaboration by tier:
- Starter - Limited project commenting
- Pro (team plans) - Simultaneous editing, slide library, dynamic fields, team project management
- Enterprise - All Pro features plus approval workflows, enhanced workspace visibility, SSO, 2FA, and audit logging
How team collaboration works in practice:
- Simultaneous editing - Multiple team members can work on the same presentation at once, similar to Google Slides
- Slide library - Save frequently used slides as team resources. New presentations can pull from approved slide templates
- Dynamic fields - Create templates with placeholder fields that team members fill in. Useful for sales decks where company names, dates, and metrics change per client
- Project analytics - Track views, shares, and engagement on published content
For marketers managing brand assets across a team, the combination of brand kit enforcement and slide libraries keeps everyone aligned without constant design reviews.
How Much Does Visme Cost?
Understanding which tier you actually need saves money. Here is the honest breakdown.
| Tier | Price | AI Credits | Key Exports | Best For |
|---|---|---|---|---|
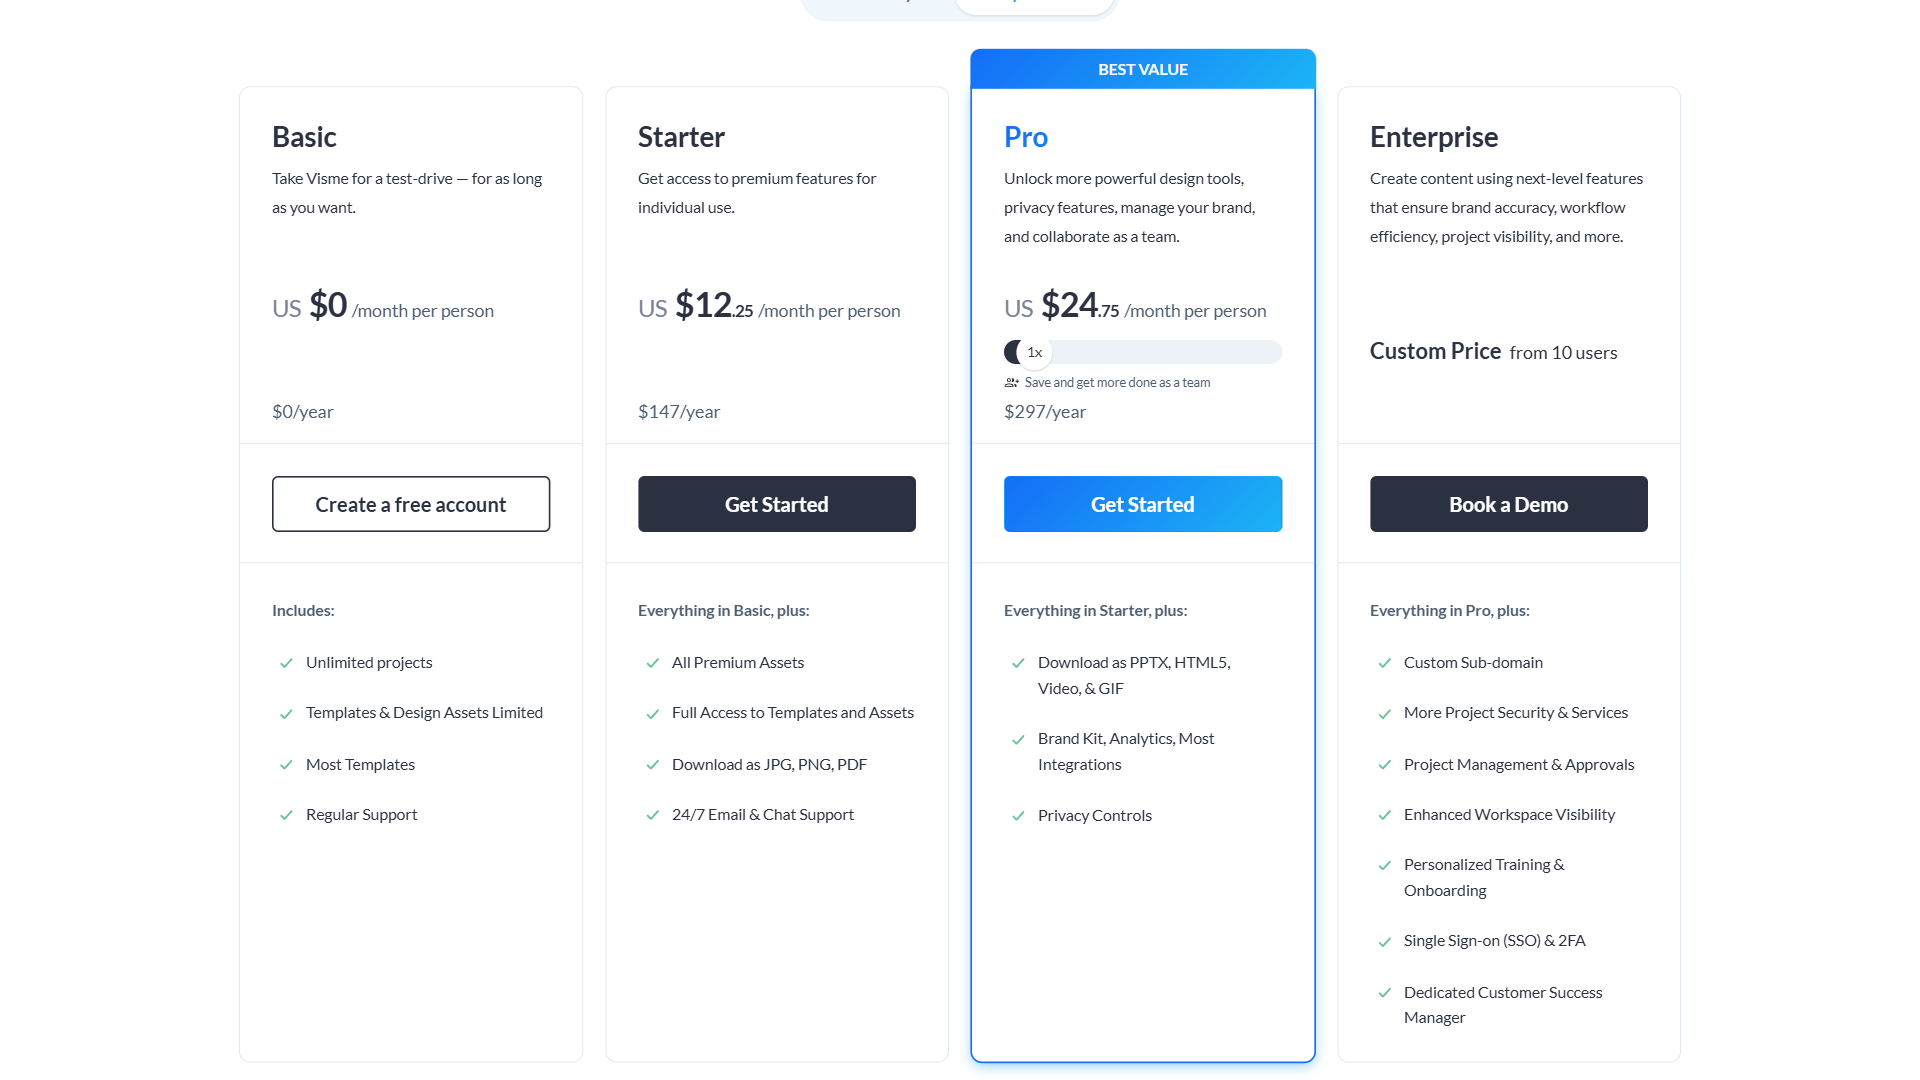
| Basic | Free | 10/month | None (no downloads) | Preview only |
| Starter | $29/month | 200/month | JPG, PNG, PDF | Solo users, basic needs |
| Pro | $59/month (annual) | 500/month | PPTX, HTML5, video, GIF | Professionals, teams |
| Enterprise | Custom | Unlimited | All + SCORM | Organizations, compliance |
The honest assessment:
The Basic (free) tier is effectively a demo. You can design presentations and infographics but cannot download or export anything. The watermark on all content makes it unsuitable for any professional use. Treat this as a test drive, not a working tool.
Starter at $29/month works for solopreneurs and freelancers creating JPG/PNG/PDF exports. You get the full template library and 200 AI credits, which is enough for 15-20 AI-assisted designs per month. The limitation is no PPTX or HTML5 export - if your clients need PowerPoint files, you need Pro.
Pro at $59/month (annual billing) is the sweet spot for professionals. PPTX export for client compatibility, HTML5 for interactive web content, video export for social media repurposing, and the brand kit for consistency. The 500 AI credits handle heavy AI usage comfortably. Check the current pricing page for the latest rates.
Enterprise adds unlimited AI credits, SSO, SCORM export for LMS integration, approval workflows, and a dedicated customer success manager. Necessary for organizations with compliance requirements or large teams needing governance features.
Tips for Getting the Most Out of Visme
Here are the workflows and habits that make the biggest difference with Visme.
Start with Templates, Not Blank Canvas
Even experienced users should start from templates. Visme’s templates handle layout, spacing, and visual hierarchy decisions that take time to get right from scratch. Customize colors, swap content, and rearrange elements rather than building from zero.
Use the AI Designer for First Drafts
Do not try to perfect your AI prompt. Give the AI Designer a rough description and let it generate a starting point. It is faster to edit an AI-generated layout than to build one manually. A good approach is to generate 3-4 variations and combine the best elements from each.
Build a Slide Library Early
If you create presentations regularly, invest time upfront building a library of reusable slides - title slides, data slides, team slides, closing slides. Future presentations become assembly rather than creation. The same approach scales to other AI design tools - see our best AI design tools roundup.
Export Strategy Matters
Think about your output format before you start designing. HTML5 presentations support interactivity that PPTX exports cannot reproduce. If your audience will view the content in a browser, design for HTML5 from the start. If they need a PowerPoint file, avoid interactive elements that will not transfer. The Visme brand kit tutorial walks through export-friendly design patterns.
Keyboard Shortcuts Save Hours
Visme supports keyboard shortcuts for common actions. Learn at least these five:
- Ctrl+D - Duplicate selected element
- Ctrl+G - Group selected elements
- Ctrl+Z - Undo
- Ctrl+Shift+Z - Redo
- Arrow keys - Nudge elements for precise positioning
The Bottom Line
Visme presentations infographics deliver professional results and data visualizations without requiring design expertise. The AI Designer accelerates creation, the brand kit ensures consistency, and the export flexibility (PPTX, HTML5, video, GIF) is unmatched by competitors in the design space.
The platform is not perfect. The free tier is effectively unusable for real work since it blocks all downloads. Pricing for the Starter plan is higher than Canva Pro. Complex projects with heavy animations can cause performance lag on mid-range hardware. And the cloud-only architecture means no offline work.
But for graphic designers, marketing teams, and business professionals who create visual content regularly, the combination of presentation builder, infographic maker, data visualization tools, and AI-powered design assistance makes Visme a strong choice. Start with the free tier to test the editor, then move to Starter or Pro based on your export needs.
Frequently Asked Questions
Can you download files on Visme’s free plan?
No. The free Basic tier blocks all downloads and applies a watermark to every design. You can build presentations and infographics in the editor, but nothing can be exported for professional use. It functions as a preview of the platform before committing to a paid plan.
How does Visme compare to Canva for presentations and infographics?
Canva excels at quick social media graphics, while Visme covers presentations, infographics, and data visualization in one platform. Visme also offers live data integration, interactive HTML5 exports, and a more comprehensive data visualization toolkit - features Canva does not match. Canva Pro is cheaper than Visme Starter at $29/month.
What does Visme’s AI Designer actually do?
You type a prompt - such as ‘quarterly revenue presentation for SaaS company’ - and the AI Designer generates a complete design in under 60 seconds. AI-generated designs typically need only minor adjustments rather than full rework. The feature draws from a shared monthly AI credit pool alongside the AI Writer, Image Generator, and TouchUp Tools.
Which Visme plan is best for professionals needing PowerPoint export?
Pro at $59/month (annual billing) is the recommended option. It includes PPTX export for client compatibility, HTML5 for interactive web content, video and GIF export, brand kit access, and 500 AI credits per month. Starter at $29/month does not include PPTX export, making Pro the practical choice for anyone delivering PowerPoint files to clients.
Can Visme connect to live data sources like Google Sheets?
Yes. Visme supports live data integration, allowing charts and dashboards to connect to external sources. A monthly performance dashboard linked to Google Sheets updates automatically when new data is added. This removes the need to manually rebuild visuals for recurring reports.
Want to learn more about Visme?
Related Guides
- Visme Brand Kit Tutorial - Maintain design consistency across teams
- AI Presentation Creation Guide - Cross-tool workflow for AI-assisted decks
- How to Summarize Meetings with AI - Convert meetings into Visme infographics
Related Reading
- Visme Review
- Gamma Review
- Beautiful.ai Review
- Canva Review
- Visme Brand Kit Tutorial: Maintain Design Consistency Across Teams
- Best AI Design Tools 2026
- Best AI Presentation Tools
- AI Presentation Creation Guide
- Canva Competitors 2026
External Resources
- Visme AI Features - Official overview of AI Designer, AI Writer, AI Image Generator, and TouchUp tools
- Visme Pricing - Current pricing tiers, feature comparison, and annual billing discounts
- Ameritas Insurance Case Study - How enterprise teams reduced design turnaround from weeks to hours using Visme
Related Guides
- Activecampaign AI Content Generation: Complete 2026 Guide
- AI Presentation Creation Guide: Gamma, Beautiful.ai
- Leonardo AI Marketing Images: 2026 Walkthrough for Teams
- Mailchimp AI Features Guide: 2026 Walkthrough for Teams
- Murf AI Pronunciation Control and Emphasis | Guide 2026
- Sider AI Browser Productivity: Complete 2026 Guide
- Visme Brand Kit Tutorial: 2026 Walkthrough for Teams