The Tidio analytics dashboard is where raw conversation data turns into decisions. Every chat your team handles through the chat widget, every question Lyro answers, every customer who waits too long for a reply - it all shows up here as numbers you can act on. Without this dashboard, you are running your support operation on gut feeling. With it, you know exactly where to invest your time, which agents need coaching, whether your AI is actually helping, and how your performance stacks up against the benchmarks that matter for your industry. Think of this guide as your dashboard tutorial - a walkthrough of every metric that matters so you can start making data-driven decisions from day one.
This guide walks through every section of the Tidio analytics dashboard - from the high-level Hub view down to individual agent metrics, Tidio Lyro AI performance tracking, and report exports. Whether you check analytics daily or pull monthly reports for stakeholders, these are the numbers that should drive your customer support decisions.
What Does the Tidio Analytics Dashboard Show?
Tidio Analytics Dashboard covers the strategies and tools that deliver real productivity gains in this space. The Tidio analytics dashboard is where raw conversation data turns into decisions. This guide walks through the practical steps from setup through advanced optimization.
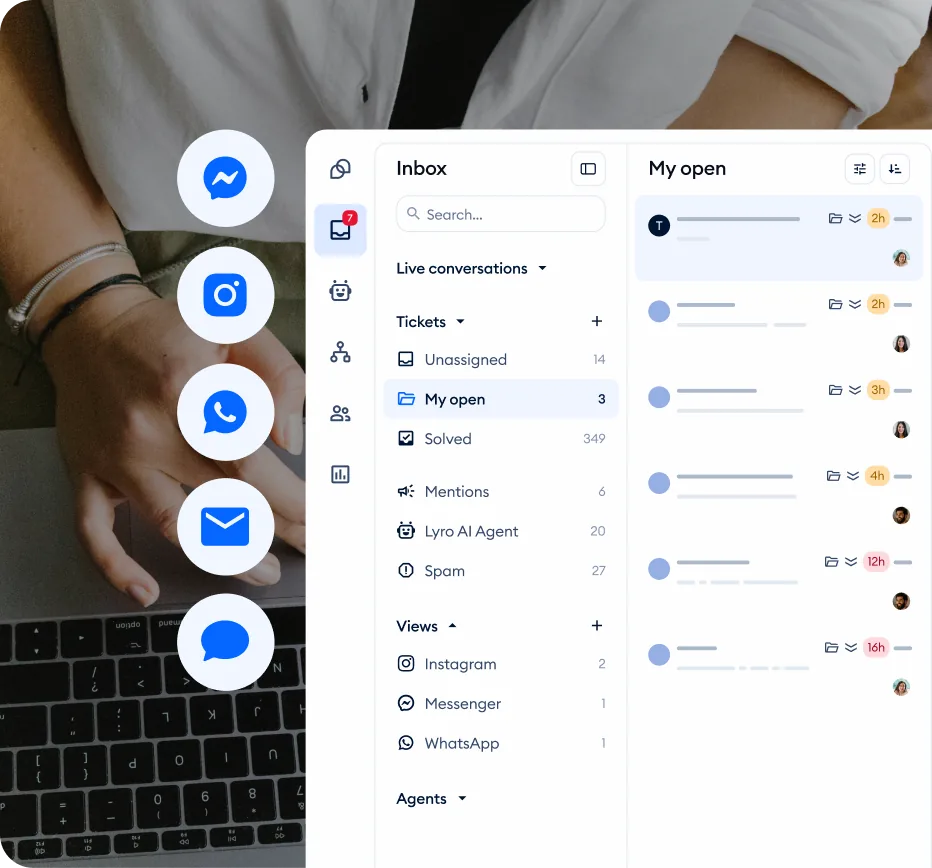
The Tidio analytics dashboard lives in the Analytics section of your left sidebar navigation. To access it, complete your dashboard login at the Tidio panel and open the dashboard app from the left sidebar. When you first open it, you land on the Hub - a centralized view that surfaces your most important metrics at a glance.
The Hub View
The Hub is your daily check-in screen. It aggregates data across all channels and agents into a set of summary cards that answer the question “how is support performing right now?”
Total conversations. The headline number showing how many customer conversations your team handled during the selected time period. This includes conversations handled by human agents, Lyro AI, and any that were a combination of both. Watch for sudden spikes - they often correlate with product launches, marketing campaigns, or site issues that generate increased support volume.
Active conversations. How many conversations are currently open and in progress. If this number is climbing throughout the day without a corresponding rise in resolutions, you have a bottleneck - either not enough agents online or conversations are taking too long to resolve.
Average response time. The mean time between a customer sending a message and an agent (or Lyro) replying. This is the single metric most strongly correlated with customer satisfaction - see Help Scout’s customer service statistics for benchmark data across industries. The Hub shows this as a real-time snapshot with a trend indicator showing whether you are improving or declining compared to the previous period.
Customer satisfaction score. If you have CSAT surveys enabled, the Hub displays your aggregate satisfaction percentage. This gives you immediate visibility into whether your team is meeting customer expectations.
Navigation Structure
Beyond the Hub, the analytics section breaks down into focused views.
- Conversations - Volume trends, channel breakdown, topic distribution
- Performance - Response times, resolution rates, handle times
- Agents - Per-agent metrics and comparisons
- Lyro AI - AI-specific conversation metrics and effectiveness
- CSAT - Customer satisfaction scores and feedback
Each view shares a consistent date range selector and filter bar, so you can drill into any time period or segment without losing context.
Which Conversation Metrics Should You Track?
The Conversations section gives you the full picture of your support volume - how much is coming in, through which channels, and how it distributes across your team.
Volume Tracking
Daily and weekly trends. The conversation volume chart plots your ticket count over time. Look for patterns: are Mondays consistently heavier than Fridays? Does volume spike after your weekly newsletter goes out? Understanding your natural rhythm helps you schedule agent coverage where it is needed most.
Channel distribution. See how conversations split across live chat, email, Messenger, Instagram, and any other channels you have connected. Customer expectations differ by channel - live chat customers expect responses in under 60 seconds, while email customers typically tolerate up to a few hours. If most of your volume flows through live chat but you have only one agent monitoring it, you have a coverage problem.
New versus returning visitors. Tidio tracks whether the person starting a conversation is a first-time visitor or a returning customer. A high ratio of returning visitors with support questions might indicate that your self-service resources need improvement.
Conversation Status Breakdown
Resolved conversations. The count of conversations that reached a successful conclusion - your throughput metric for the period.
Unresolved conversations. Conversations opened but never formally resolved. A growing backlog signals that volume is exceeding capacity or conversations are stalling. Investigate the oldest unresolved conversations first - they represent customers who have been waiting the longest.
Missed conversations. Conversations where a customer sent a message but never received a response. You want this as close to zero as possible. If this number exceeds 2-3% of total volume, adjust your coverage, enable Lyro AI for after-hours support, or set up automated routing through Tidio Flows.
Response Time Analytics
Response time is the metric your customers feel most directly. A fast, helpful answer makes customers feel valued. A slow response - even if technically accurate - makes them feel ignored.
Key Response Time Metrics
First response time. The elapsed time between a customer’s first message and your first reply. This is the most critical response metric because it sets the tone for the entire interaction. Benchmarks vary by channel:
| Field | Value |
|---|---|
| Live chat | Under 60 seconds is good. Under 30 seconds is excellent. Over 2 minutes and you are losing customer confidence. |
| Under 4 hours is acceptable. Under 1 hour puts you ahead of most competitors. | |
| Social messaging | Under 15 minutes matches customer expectations on platforms like Messenger and Instagram. |
Average response time. The mean time across all messages in a conversation, not just the first one. A large gap between first response time and average response time suggests agents are juggling too many concurrent conversations and slowing down after the initial reply.
Longest response time. The worst-case outlier for the period. If your average is 45 seconds but your longest response time is 25 minutes, someone had a terrible experience. Drill into that conversation to understand what happened - an overwhelmed agent, an after-hours message, or a complex issue that required research.
Using Response Time Data
Set internal targets. A reasonable starting target for live chat is a first response time under 60 seconds and an average response time under 90 seconds. Display these targets visibly and review them in team meetings.
Identify peak hours. Overlay your response time data with conversation volume. Response times almost certainly spike during your highest-volume periods - that tells you exactly when to schedule additional coverage or increase your Lyro AI allocation.
Measure the impact of changes. When you add an agent, enable Lyro, or implement canned responses, track response time changes over the following two weeks for concrete evidence of what is working.
Resolution Rate Tracking
Getting back to customers quickly matters, but what matters more is actually solving their problem. Resolution metrics tell you whether conversations are ending with satisfied customers or just ending.
Core Resolution Metrics
First contact resolution rate. The percentage of conversations resolved in a single interaction without the customer needing to follow up. Industry benchmark for live chat is 70-75% according to the SQM Group customer experience research. Above 80% is exceptional. Below 60% suggests agents lack either the authority or the information to solve problems independently.
Average resolution time. How long from the start of a conversation to its resolution. A conversation might have fast responses but still take 45 minutes to resolve because the issue is complex. Track this alongside resolution rate for the full picture - the Zendesk customer service metrics overview is a good reference.
Escalation rate. The percentage of conversations escalated to a senior team member or another department. Some escalation is healthy, but a rate above 15-20% usually means agents need better training, expanded permissions, or a stronger knowledge base.
Resolution by Category
If you tag or categorize conversations, compare resolution metrics across categories. Billing questions typically resolve quickly because agents have clear policies. Technical issues take longer but often achieve first-contact resolution with good troubleshooting guides. Returns and refunds may have lower resolution rates because they require approvals or involve policy edge cases. This category-level view tells you exactly where streamlining will have the biggest impact.
Agent Performance Reports
Team averages are useful for trending, but individual agent metrics are where coaching and staffing decisions happen.
Per-Agent Metrics
Navigate to the Agents section of analytics to see performance data broken down by team member. For each agent, Tidio tracks:
Conversations handled. The raw count of conversations each agent resolved. This workload metric tells you whether work is distributed evenly or whether one agent is carrying the team. Significant imbalances suggest your routing rules need adjustment - check your Flows automation settings to refine conversation routing.
Average response time per agent. How quickly each agent replies compared to the team average. Agents who consistently respond slower may be handling more complex issues, or may need training on efficiency techniques like canned responses.
Resolution rate per agent. Each agent’s first-contact resolution rate compared to the team average. A consistent gap of more than 10 percentage points warrants reviewing that agent’s conversation transcripts.
Customer satisfaction per agent. How each agent’s CSAT scores compare. An agent with fast response times but low CSAT may be rushing through conversations. An agent with slower times but higher CSAT may be taking the time to be thorough - and that is worth protecting rather than optimizing away.
Coaching with Data
Use agent metrics as coaching tools, not performance scorecards. The goal is improvement, not judgment.
Identify patterns, not incidents. A single bad conversation is noise. Three weeks of declining response times is a pattern that needs attention.
Pair high and low performers. Have top-scoring agents share their approach. The difference often comes down to specific phrases or workflow habits that are easy to teach once identified.
Set incremental goals. If an agent’s first-contact resolution rate is 65%, targeting 70% next month is realistic. Targeting 85% is discouraging and counterproductive.
Lyro AI Analytics
If you are running Lyro AI, the analytics dashboard includes a dedicated section for tracking your AI’s performance. This is where you evaluate whether automation is helping your operation or creating new problems.
Lyro Performance Metrics
Conversations handled by Lyro. The total count and percentage of conversations Lyro resolved without human intervention. If you are paying for 200 Lyro conversations per month but only using 80, you have room to expand scope. The full Tidio AI agent feature breakdown covers what Lyro can take on. If you are consistently hitting your limit, consider upgrading your plan.
Lyro resolution rate. The percentage of Lyro conversations that ended with the customer’s question answered - no handoff required. A healthy rate is 60-70% for a well-configured knowledge base. Below 50% means Lyro is frequently failing, creating frustration for customers who then repeat themselves to a human agent.
Handoff rate. How often Lyro transfers to a human agent. Track which question types trigger handoffs - these are your knowledge base gaps. Each handoff represents a topic you could add to your knowledge base.
Lyro CSAT. Compare satisfaction scores for Lyro-handled versus human-handled conversations. AI conversations typically score 5-10 points lower industry-wide. If your Lyro CSAT is within 5 points of your human team, your AI configuration is performing well. A gap larger than 15 points suggests your knowledge base content or Lyro tone settings need attention.
Optimizing Lyro with Analytics
Weekly knowledge base audits. Review conversations where Lyro could not provide an answer. Group unanswered questions into themes - the most frequent themes are your highest-priority knowledge base additions.
Monitor deflection rate. This measures how many conversations Lyro prevents from reaching human agents. A rising rate means Lyro is becoming more effective. A flat rate despite adding content means the new content does not match what customers actually ask.
Compare AI and human handle times. Lyro typically resolves faster because it responds instantly. But if Lyro conversations have longer total durations - customers going back and forth multiple times - the AI may be providing incomplete answers that require clarification.
Custom Date Ranges and Filters
The analytics dashboard becomes significantly more useful when you slice the data by time periods and segments that match your business questions.
Date Range Options
Preset ranges. Quick-select buttons for Today, Last 7 Days, Last 30 Days, and Last 90 Days cover most daily and weekly check-ins. Use Last 7 Days for operational monitoring and Last 30 Days for trend analysis - the Tidio analytics help center covers each preset in detail.
Custom date ranges. Select any start and end date for specific analysis. This is essential for measuring impact - compare the 30 days before a process change to the 30 days after.
Comparison periods. Some views let you overlay two time periods for direct comparison. Select this month and last month, and the charts show both periods side by side - the fastest way to answer “are we improving?”
Filter Options
By channel. Isolate metrics for a specific channel. Your live chat response times might be excellent while email lags behind - filtering by channel reveals differences hidden in aggregate numbers.
By agent. View all metrics through the lens of a single agent for one-on-one coaching conversations.
By tag or category. If your team tags conversations by topic or issue type, filter analytics by these tags to understand which areas generate the most volume and which have the best or worst resolution metrics.
How Do You Benchmark Your Tidio Metrics?
Raw numbers only become meaningful when you have context. Benchmarking helps you understand whether your performance is competitive, adequate, or falling behind.
Industry Benchmarks
Use these as directional guidance, not rigid targets. Your specific benchmarks depend on your industry, company size, product complexity, and customer expectations.
Response time benchmarks:
- Excellent: First response under 30 seconds (live chat), under 1 hour (email)
- Good: First response under 60 seconds (live chat), under 4 hours (email)
- Needs improvement: First response over 2 minutes (live chat), over 8 hours (email)
Resolution rate benchmarks:
- Excellent: First contact resolution above 80%
- Good: First contact resolution between 70-80%
- Needs improvement: First contact resolution below 60%
CSAT benchmarks:
- Excellent: Above 90% satisfaction
- Good: Between 80-90% satisfaction
- Needs improvement: Below 75% satisfaction
Lyro AI benchmarks:
- Well-configured: Resolution rate above 65%, CSAT within 5 points of human agents
- Adequate: Resolution rate between 50-65%, CSAT within 10 points of human agents
- Needs work: Resolution rate below 50% or CSAT more than 15 points below human agents
Internal Benchmarking
Beyond industry comparisons, your most valuable benchmarks come from tracking your own progress.
Month-over-month trends. Plot each key metric monthly and watch the trajectory. A steady upward trend in resolution rate matters more than whether you hit a specific number in any given month. Progress is the goal.
Before-and-after analysis. When you make a change - adding an agent, expanding Lyro’s knowledge base, implementing new routing rules - compare the 30 days before to the 30 days after. This gives you clean evidence of whether the change had the intended effect.
Seasonal awareness. Most businesses see predictable seasonal patterns in their support metrics. E-commerce sellers see volume spikes during holiday periods. SaaS companies see spikes after major releases. Knowing your seasonal patterns prevents you from overreacting to predictable fluctuations.
How Do You Export Reports from the Tidio Analytics Dashboard?
Dashboard views are useful for daily monitoring, but stakeholder reporting and long-term analysis require exported data.
Export Options
CSV exports. Most analytics views offer CSV download. Import the raw data into spreadsheets for custom analysis, pivot tables, or integration with your existing reporting tools - even free tools like Google Sheets handle this well. Exports include all data points in the current view, respecting your selected date range and filters.
Scheduled reports. Depending on your plan, set up automated email reports delivering key metrics on a daily, weekly, or monthly cadence - useful for managers who need summaries without logging in.
Screenshot and PDF. Dashboard views are designed to be screenshot-friendly. The clean chart layouts translate well into presentation slides or email updates.
Building a Reporting Routine
Daily check. Spend two minutes on the Hub view each morning. Look at active conversations, response times, and any CSAT alerts. This is your operational pulse check.
Weekly review. Once per week, spend 15-20 minutes in the detailed views. Review agent performance, check Lyro effectiveness, and identify any trends that emerged during the week. Make one specific improvement decision based on what you find.
Monthly report. Pull a 30-day export and compare to the previous month. Summarize the key movements - what improved, what declined, and what you plan to do about it. Share this with your team and any stakeholders who need visibility into support performance.
Pro Tips
Start with three metrics, not thirty. The dashboard offers a wealth of data, and it is tempting to monitor everything. Resist that impulse. Pick three metrics that matter most to your business right now - typically first response time, resolution rate, and CSAT - and focus on moving those. You can expand your tracking as those stabilize.
Set up alerts for anomalies. If your average response time suddenly doubles or your missed conversation rate spikes, you want to know immediately - not when you check the dashboard hours later. Configure notifications for metric thresholds that indicate something needs attention. Pair this with a Tidio canned responses workflow so agents can react quickly during volume spikes.
Compare weekday and weekend performance separately. Blending weekday and weekend data into a single average masks real performance differences. Most teams see slower response times and lower CSAT on weekends. Knowing this helps you plan coverage and set realistic expectations for off-peak periods.
Use analytics to justify Lyro expansion. When requesting budget for additional Lyro conversations or a plan upgrade, pull the data showing how many conversations Lyro handles, what the resolution rate is, and what the cost per conversation would be if those were handled by human agents instead. Data-driven requests get approved faster than opinion-based ones.
Review handoff conversations monthly. The transition point where Lyro transfers a conversation to a human agent is a critical moment. Pull a sample of handoff conversations each month and check whether the transition is smooth, whether the human agent has sufficient context, and whether the customer had to repeat information. Lyro Tasks and Actions can help automate context transfer during these handoffs.
Frequently Asked Questions
How long does it take for data to appear in the Tidio analytics dashboard?
Conversation data appears in the Tidio analytics dashboard in near real-time. Basic metrics like active conversations and response times update within minutes. Aggregated metrics like daily averages and trend charts typically refresh at regular intervals throughout the day. For newly enabled features like CSAT surveys, allow 24-48 hours for the first meaningful data to accumulate before drawing any conclusions.
Can I track Lyro AI and human agent metrics separately?
Yes. The Tidio analytics dashboard provides dedicated views for Lyro AI performance alongside human agent metrics. You can filter conversations by resolution type to see how each performs independently. This separation is essential for evaluating whether your AI automation meets the same quality standards as your human team and for identifying specific areas where the knowledge base needs improvement.
What Tidio plan do I need to access the full analytics dashboard?
Basic analytics are available on all paid Tidio plans. Advanced features like per-agent performance breakdowns, custom date range comparisons, detailed Lyro AI analytics, and CSV exports are typically available on the Growth plan and above. The Premium plan includes the most comprehensive analytics suite alongside unlimited Lyro conversations. Check the official Tidio pricing page for the most current feature availability by tier.
How do I know if my response times are good enough?
For live chat, aim for a first response time under 60 seconds - this is the threshold where customer satisfaction remains consistently high. Under 30 seconds is excellent and puts you ahead of most competitors. For email support, under 4 hours is considered good. The most reliable benchmark is your own trend line: are you improving month over month? A 45-second first response time that is trending downward is better than a 30-second time that is trending upward.
Can I export analytics data for use in external reporting tools?
Yes. Most analytics views support CSV export, which you can import into spreadsheets, business intelligence tools, or custom dashboards. Select your desired date range and filters before exporting to ensure the data matches what you need. For regular reporting, consider setting up scheduled email reports that automatically deliver key metrics on a daily, weekly, or monthly cadence.
Why do my Lyro AI satisfaction scores differ from my human agent scores?
This is normal and expected. AI-handled conversations typically score 5-10 percentage points lower than human-handled conversations across the industry. The gap exists because AI cannot match human empathy and adaptability in nuanced situations. If your gap is within 5 points, your Lyro configuration is performing well. If the gap exceeds 15 points, review your knowledge base for incomplete answers and consider adjusting your Lyro tone settings to better match your brand voice.
Want to learn more about Tidio?
Related Guides
- Getting Started with Tidio - Account setup, widget installation, and initial configuration
- Tidio CSAT Tracking Guide - Setting up and analyzing customer satisfaction surveys
- Tidio Copilot Agent Assist - AI-powered reply suggestions to boost agent performance
- Tidio Lyro AI Setup Guide - Configuring Lyro for automated AI conversations
- Tidio Flows Automation Guide - Visual Flow builder walkthrough and routing rules
- Tidio Team Management Guide - Coaching agents using analytics data
Related Reading
- Tidio - Full review with pricing breakdown and feature analysis
External Resources
- Tidio Analytics Help Center - Official documentation for every analytics metric and view
- Customer Service Metrics Reference - Industry context for first response time and CSAT benchmarks
- Help Scout Customer Service Statistics - Benchmark data for resolution rate and channel performance
Related Guides
- AI Chatbots Customer Service Setup: Complete 2026 Guide
- AI Customer Service Automation: Chatbots vs Agentic AI
- Tidio Abandoned Cart Recovery: Automation Workflows
- Tidio Canned Responses and Macros for Faster Support
- Tidio Copilot Agent Assist: AI-Powered Agent Assist Guide
- Tidio CSAT Tracking: CSAT Tracking and Improvement
- Tidio Ecommerce Chatbot: Tidio Chatbot Flows for Ecommerce
- Tidio Ecommerce Support Automation: Automation Best
- Tidio Flows Automation: Visual Automation Builder Guide
- Tidio Getting Started Guide - Full Setup in 20 Minutes